

Description
Stone Technologies is a professional Manufacturer of HMI Intelligent TFT LCD modules. Depending on the application the Stone Technologies offers Industrial Type, Advanced type, and Civil Type Intelligent TFT LCD modules available in different sizes. Visit Here .
In this project I am going to measure the unknown resistance and will display it on Stone HMI display. Here I am using STWI056WT/N-01 model for our in this project, if you want to understand data frame and how it is working? you can download the Datasheet from here .
Component List
[1] STONE-HMI Display [STWI056WT/N-01]
[3] TTL to USB converter
[4] Few Resistors
[5] USB cables
[6] Jumper Wires
GUI Designing
Let’s start first with interface designing but before that you have to install Stone Designer and the Driver for USB so let see how to install these software.
Step-1 :- Go to this website and download these software and then install them in your computer.
Website Link :- https://www.stoneitech.com/support/download/software

After installed , go to Stone-Designer icon and click on that after that designer software will open and you will get this type of interface as shown in image.

After opened you have to create a new project for this select ‘Project’ from top and from that select ‘new’ and you will ask for the some details as shown in the below figure , now give the name of project and select screen size as per your display size, here I’m using 640X480 size display , and select project path also after done with filling all the details click on ‘Create’ .

After done with above part select the background image for the project for this follow steps as shown in the figure.
step-1 :- Select ‘image’ from Resources to upload the image.
Step-2:- Click on Add button to add a new image in it , so I added an image as you can see in the below image as name ‘1’.
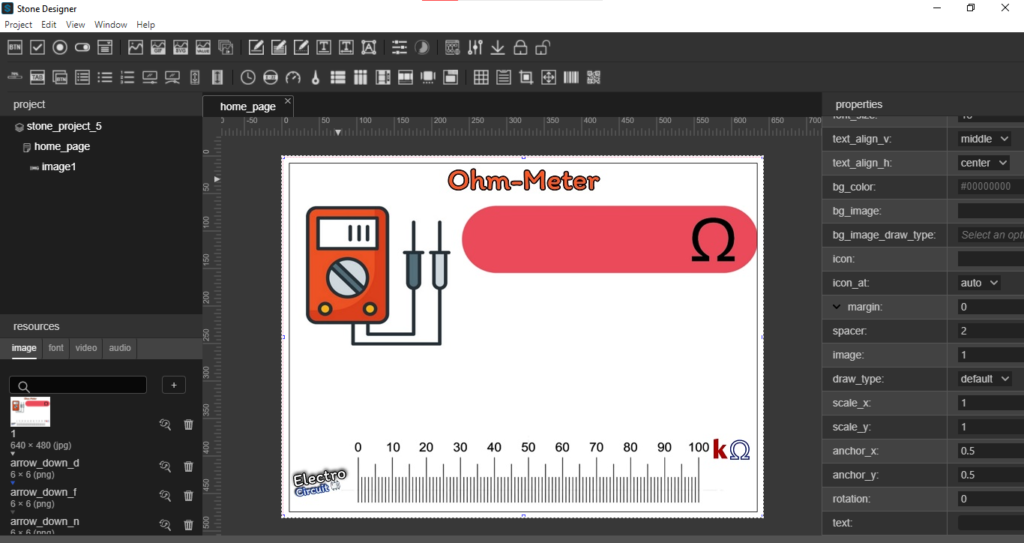
Step-3:- Now drag image widget from top and put it in the edit section.
Step-4:- Now go to at properties and select image as ‘1’ and click on enter.
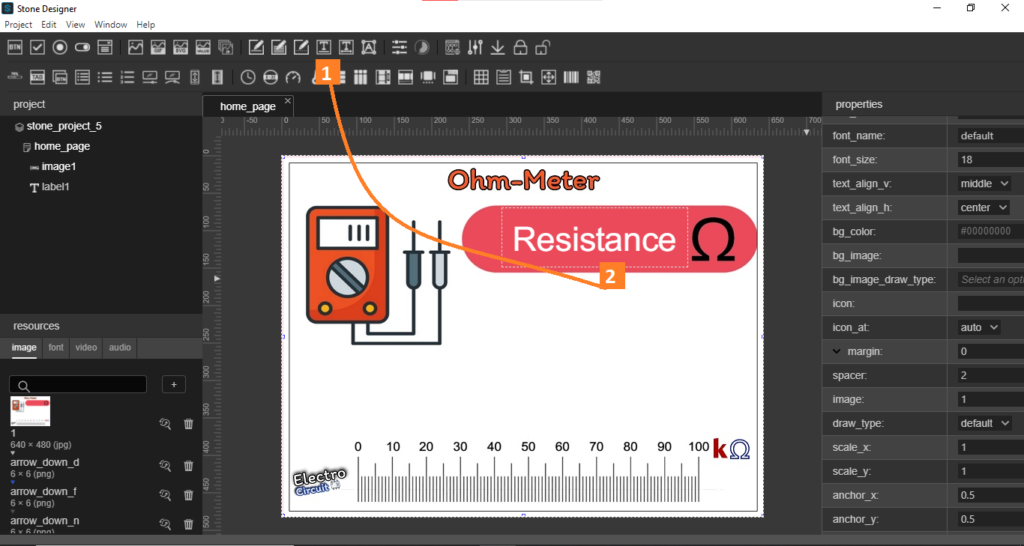
Step-5:- After this add widget(Label & Slider) on image which we have added below. For this drag label(widget) and put it on label section, as shown in the below figure. Follow these steps to add this widget as per below figure/image.
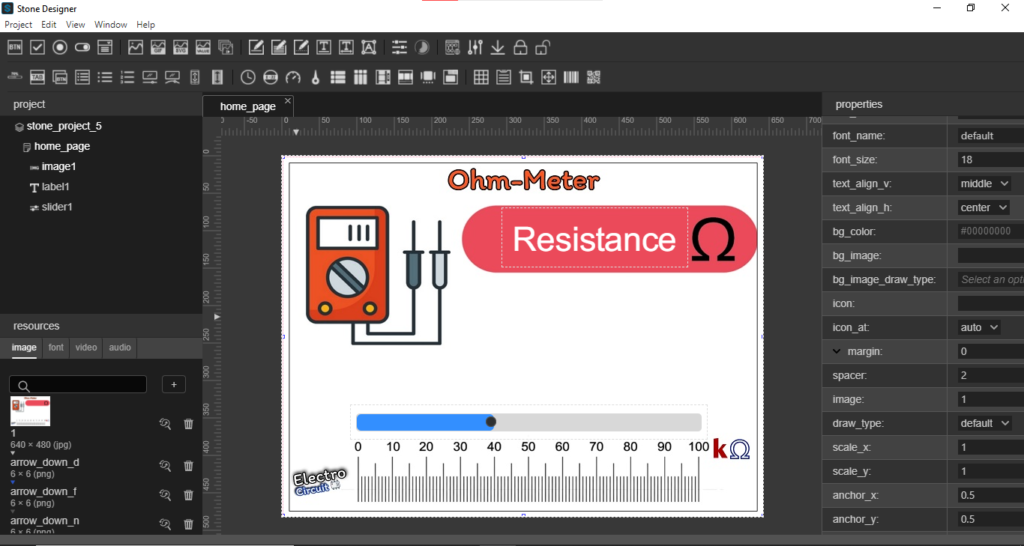
Step-6:- After done with this ,drag slider from top as shown in below figure . Here also follow steps as per the image given below.
Now we have completed with GUI design let’s move toward the project uploading on the display.
Note:- Here we have selected widget as ‘label’ & ‘Slider’ .
name :- label1 & name:- slider1
type:– label & type:– slider
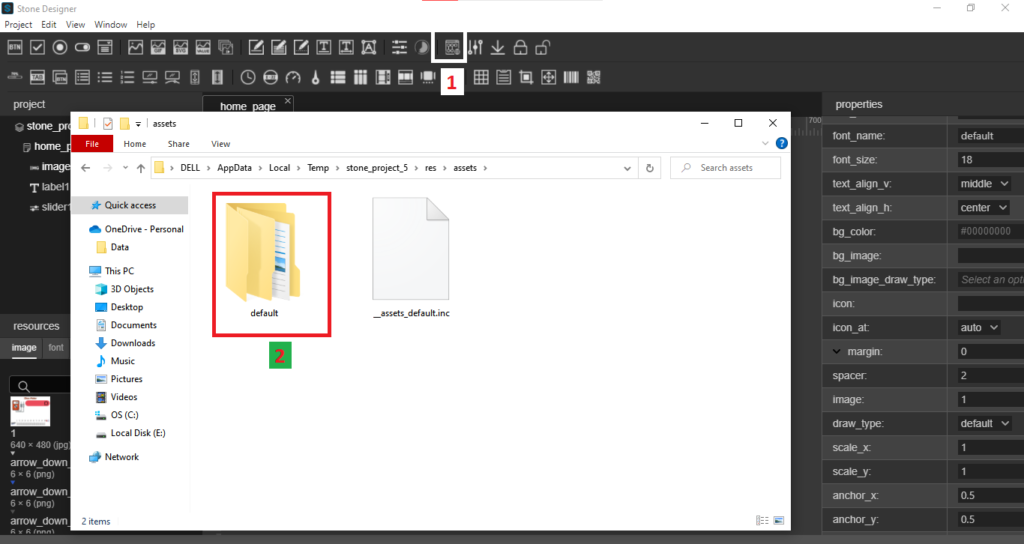
Step-7:- This step is important because you have to remember some data from there and this data we will use for further steps or I can say for coding part.
Then compile the design by click on compile button. Now plug USB with your PC and copy that ‘default’ folder in memory of Display. For more details see the YouTube video. So now let’s move further to understand how code is working. Follow these steps as mentioned in below image.
Now we have done with Design part now let’s move to coding and working part.
Working & Code
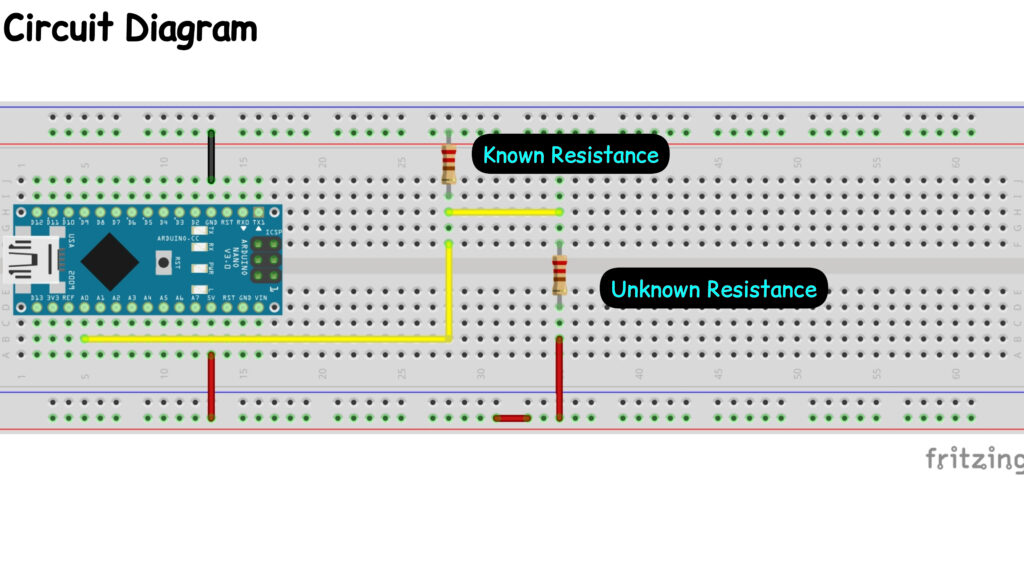
Let’s First understand how Resistance meter is working?
The circuit is really simple. All you need is an Arduino, the resistor you want to measure, and another resistor with a known value. We’ll set up a voltage divider with the known and unknown resistors, here known resistance value is 56k ohm you can use other also but according to this you have to change in code. Here This unknown resistance data will send to the display by using Jupyter, if you want you can use CMD or Raspberry-Pi also.
Arduino Code :-
int analogPin = 0;
int raw = 0;
int Vin = 5;
float Vout = 0;
float R1 = 56000;
float R2 = 0;
float buffer = 0;
void setup()
{
Serial.begin(9600);
}
void loop(){
  raw = analogRead(analogPin);
  if(raw){
    buffer = raw * Vin;
    Vout = (buffer)/1024.0;
    buffer = (Vin/Vout) - 1;
    R2= R1 * buffer;
    Serial.println(R2);
    delay(500);
  }
}
The above code is sending the unknown resistance data to display through Jupyter. This below code is calculating the resistance by the concept of voltage divider. As you can see in the below code section.
 if(raw){
    buffer = raw * Vin;
    Vout = (buffer)/1024.0;
    buffer = (Vin/Vout) - 1;
    R2= R1 * buffer;
    Serial.println(R2);
Let’s upload the code in Arduino but before that select port number and Arduino board. Now let’s move forward and understand how python code is sending the data to Display.
Python Code :-
import serial
display=serial.Serial('COM4', 115200)
arduino=serial.Serial('COM5', 9600)
if __name__ == '__main__':
    while True:
        if arduino.in_waiting > 0:
            line = arduino.readline().decode('utf-8').rstrip()
            y=int(float(line))
            print(line)
            slider='ST<{"cmd_code":"set_value","type":"slider","widget":"slider1","value":'+str(y/1000)+'}>ET'
            label='ST<{"cmd_code":"set_value","type":"label","widget":"label1","value":'+str(y)+'}>ET'
            display.write(str(slider).encode())
            display.write(str(label).encode())
The above code is responsible for sending data from Arduino to Display.
display=serial.Serial('COM4', 115200)
arduino=serial.Serial('COM5', 9600)
These lines are the function for to read and write the data for Arduino & Display, as mentioned in name. In case of Arduino I used Baud-rate 9600 and 115200 is for Display.
 if arduino.in_waiting > 0:
            line = arduino.readline().decode('utf-8').rstrip()
These above two lines will read the data from Arduino and then this data is stored in the ‘line’ variable. And below code is sending the that stored data to the Display with the help of serial library.
y=int(float(line))
            print(line)
            slider='ST<{"cmd_code":"set_value","type":"slider","widget":"slider1","value":'+str(y/1000)+'}>ET'
            label='ST<{"cmd_code":"set_value","type":"label","widget":"label1","value":'+str(y)+'}>ET'
            display.write(str(slider).encode())
            display.write(str(label).encode())

As you can see in the above image and in code , this frame we will send to Stone-Display and display will show the Resistance reading on Label as well as on Slider.
These are the frame which we are sending through jupyter First is for Slider reading and second is for Label reading.
slider=’ST<{“cmd_code”:”set_value”,”type”:”slider”,”widget”:”slider1″,”value”:’+str(y/1000)+’}>ET’
label=’ST<{“cmd_code”:”set_value”,”type”:”label”,”widget”:”label1″,”value”:’+str(y)+’}>ET’
Now let’s Run the code in Jupyter but before this connect both USB that is Display & Arduino to your Computer/PC.
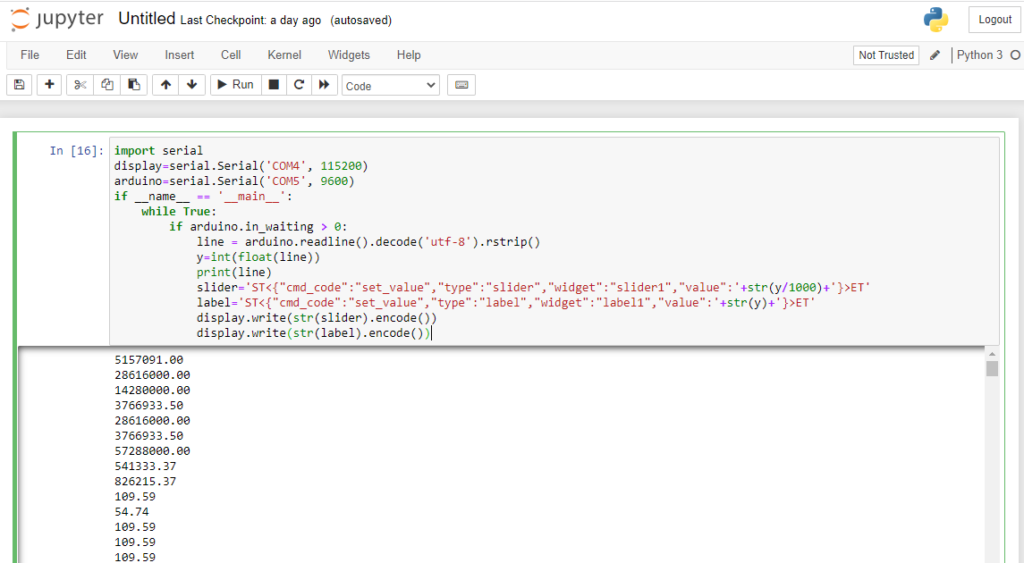
After click on Run button you will see this type of screen and the resistance value data is available on here also, let’s see the output on Display.
Output Video
YouTube Video
Thankyou so much to read the article till now there is YouTube video on this project so please go through that video to understand the whole procedure in a better manner there is link for video go and check it out.
